About three weeks ago, we blogged about a hackathon we had in the late summer. I was one of the participants and as my hackathon topic I decided to find out how IndoorAtlas Data API could be used for heatmap visualization. I am not a web developer, but I had heard that Scala.js makes web development more tolerable by introducing strong typing, good IDE support, and allowing you to write Scala code that is then compiled to JavaScript and runs in any browser. It was time to step out of the comfort zone and learn something new!
I spent most of the first hackathon day trying to figure out what tool versions and libraries in the Scala.js toolchain work together. However, after that was sorted out, everything suddenly became smooth, using the Data API was straightforward, and writing the business code was a joy. The libraries I ended up using were
- uPickle – JSON serialization library for Scala
- Scala-js-dom – Statically typed Scala interface for the DOM
- ScalaTags – XML/HTML construction library for Scala
- MapBox GL JS – JavaScript library for rendering interactive maps
After some code cleaning, we decided to make the end result public using GitHub Pages. The web service allows IndoorAtlas account holders to visualize their user position estimate data as a heatmap by providing a Data API key, list of dates and floor numbers. For getting the general picture, one can also simply use the Example button on the live demo page to visualize a fixed demo data set.
I personally was excited how nicely the heatmaps summarize the user walking patterns, and how you can easily see the most used areas in the venue. I hope this example helps and inspires IndoorAtlas users to either implement their own data-based services or just to visualize their data with the provided tool.
The Github Pages version with a working live demo can be found here, and the source code demonstrating the Data API usage is available here.
Happy coding, data exploration and analysis!
Ilari Vallivaara
R&D Engineer
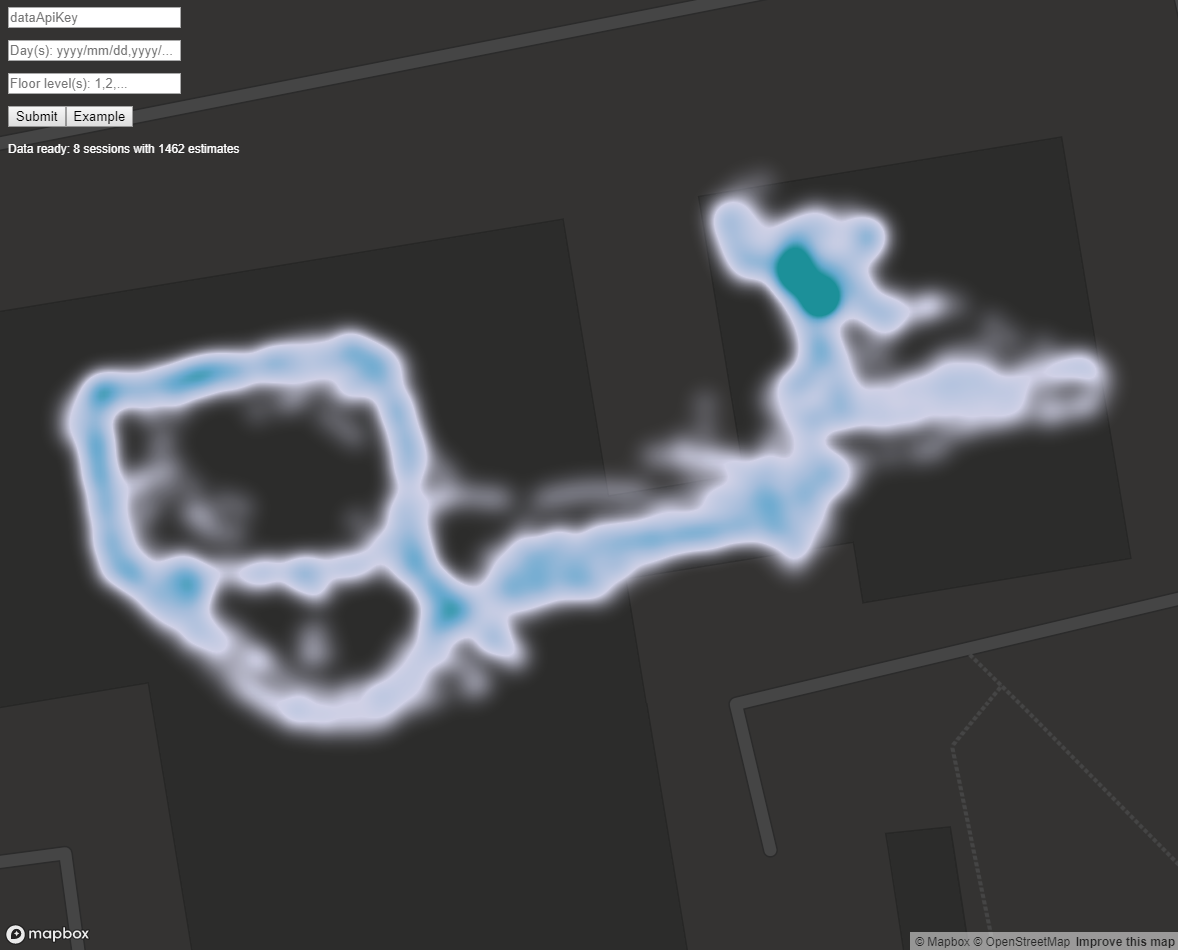 Heatmap example