Note: This document refers to the MapCreator version 1.x.
Click here for manual of MapCreator 2.0
By Elina Peltola, Customer Support Engineer
Once you have a space mapped with several mapping paths and you’ve confirmed that positioning works, it’s time to start optimizing the map’s positioning accuracy. A great tool for this is the “Test Paths” function of MapCreator 1.5. Instead of trying to visually confirm that positioning results match expectations, you can record test paths to be part of the map and see summary analysis as a quality report for your map. Recording test paths is similar to recording the magnetic map data.
Notable differences to map recording:
1. Test path recording supports multi-path recording. You can plan longer test paths covering more of your map. When recording a multi-path, walk at steady speed through the path and tap the screen at each turn. This is to keep the data recording accurate and aligned also in the corners.
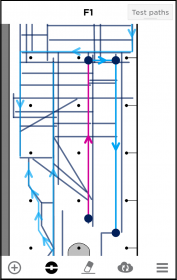
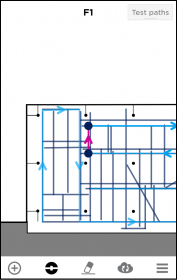
2. While mapping may at times require very short paths in tight turns, it’s a good idea to use the multi-line test paths to make every test path longer. Test paths should usually be at least 15-20 meters long.
3. You do not have to cover every mapped path but the more you have test paths the better analysis of the quality can be made and shown on the developer website. Small venues should have full coverage of the mapped area with test paths. For large venues we suggest that you record test paths for at least 10-15% of the mapped area.
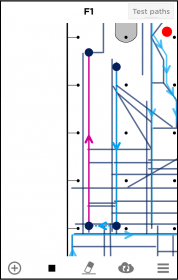
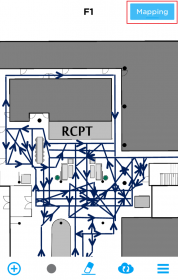
You can go to the testing mode by pressing the blue “Mapping” button on the top right corner of the MapCreator 1.5. This button indicates which mode you’re in, “mapping” or “test paths”.

Where to record test paths:
1. If it is one of your first maps with simple single lines, record test paths along paths recorded in mapping mode. It’s a good idea to make the test path in the opposite direction of the mapping path.
2. Record test paths on the areas where performance seems poorer than in other places or in the areas where you want to get a quality report.
3. Think about how people flow in the space and record test paths along that flow. This will give you a report of how end users will experience positioning.
Quality Report
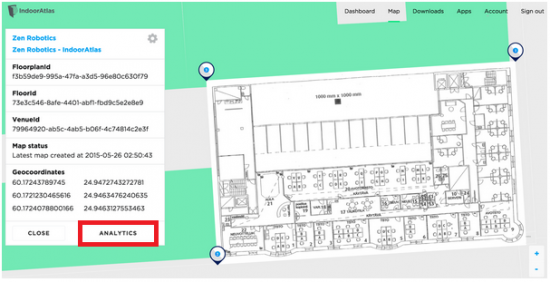
Separate report for each mapped floorplan can be found from the IndoorAtlas Maps at our website. Go to Map, your building, floor and floorplan and click the button “ANALYTICS” on bottom right corner of the dialog box.
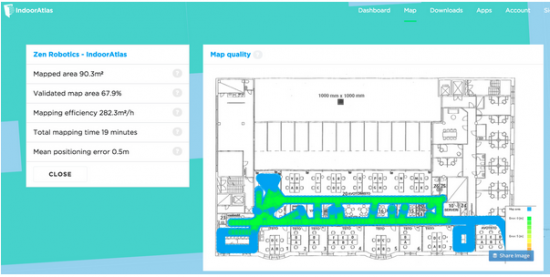
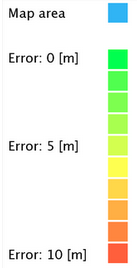
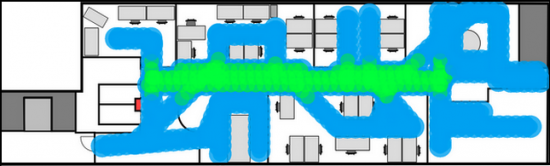
- Blue areas on the map are the areas you have mapped, where you recorded mapping paths
- Green, yellow and red areas indicate the positioning performance along test paths (according to the chart below, the error means difference between the test path you draw and the position estimation from IndoorAtlas cloud server)
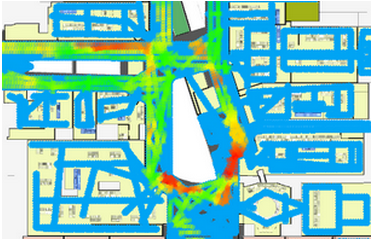
In case you find red areas in your analytics we recommend you to review both the mapping paths as well as test paths in that area.
| Problem | Way to fix |
| Lack of nearby test paths: red/blue | Record a test path through the affected area |
| Lack of nearby mapping paths: “hole” in the coverage | Record a mapping path through the affected area |
| Problem in recorded test path data: red through the test path | Delete the affected test path and re-record the test path |
| Problem in recorded mapping data: red through the test path | Delete the mapping path passing the area and re-map |
| Problem persists after remapping | You may have a problem with the mapping device. Check that your device meets the mapping device requirements, reboot the device to make sure any sensor errors are cleared. |
You may also see small spots of yellow or orange in areas where several paths converge or cross each other. These are usually the result of small errors in the start-end markings of the mapping paths, uneven walking speed, or a sign of incorrect placement of your mapping landmarks on the floorplan making it difficult to cover areas precisely. Overcoming these challenges will be discussed in more detail in an upcoming blog post “Mapping bigger areas”.
Related articles: Getting Started With The Blue Dot, MapCreator 1.5 UI Guide, Mapping Bigger Areas, Troubleshooting